- Sustainability TOP
- ESG Data
- ESG Data (Environment)
ESG Data (Environment)
| Metrics Calculation Scope |
Non-consolidated: ISUZU MOTORS LIMITED Consolidated: ISUZU MOTORS LIMITED and its 59 domestic and overseas subsidiaries*
|
|---|
Consolidated Data
Trends in GHG Emissions
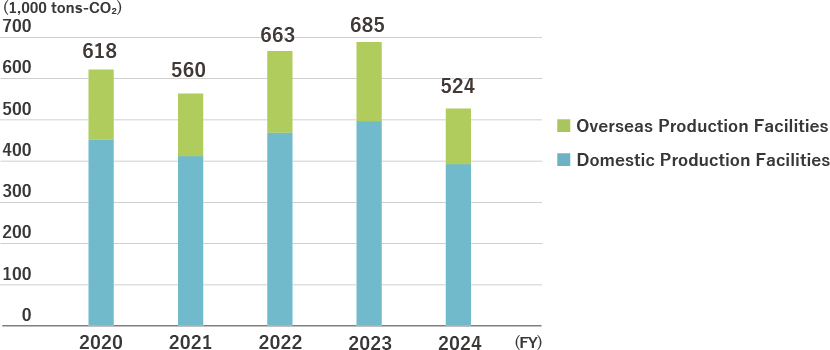
- *FY2025 results are provisional values, as companies that are still compiling their data are included in the calculation.
- *Base year emissions may be calculated retroactively in accordance with the GHG Protocol.
Trends in Waste Generation
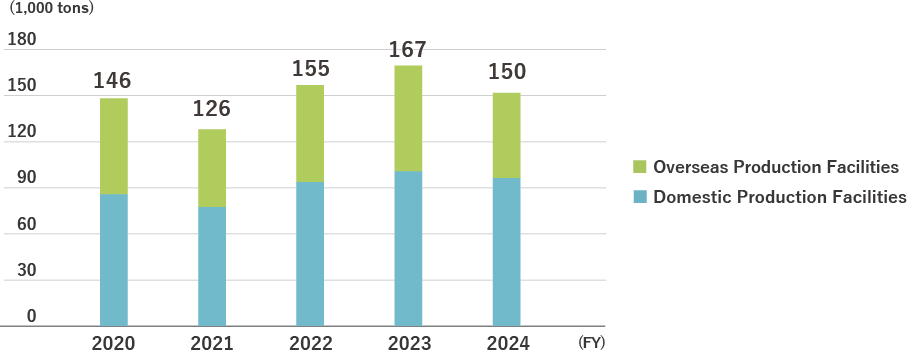
- *FY2025 results are provisional values, as companies that are still compiling their data are included in the calculation.
Non-Consolidated Data
Isuzu's Environmental Management Structures
In the past, Isuzu operated its environmental management structures on a site-by-site basis. With the revision of ISO 14001 in fiscal 2016, the systems were integrated on a Group-wide basis. In December 2016, we expanded ISO 14001 certification to all Isuzu sites, and shifted to ISO 14001:2015.
At present, Isuzu is carrying out uniform environmental initiatives across all sites. Moreover, we are undertaking company-wide efforts to reduce the environmental burden resulting from our business operations and to strengthen our environmental management.
Violations and Accidents Related to Environmental Laws and Regulations in FY2025
Isuzu had no violations or environmental accidents related to environmental laws and regulations during FY2025.
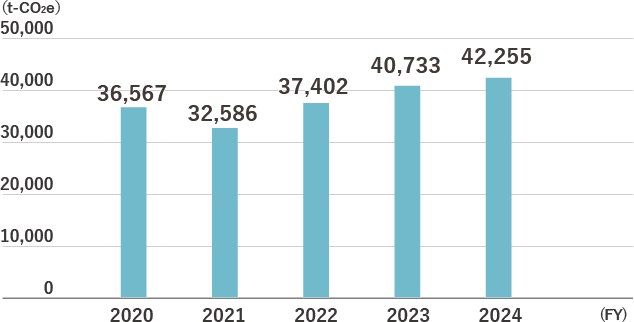
CO2 Emissions Mitigation Activities
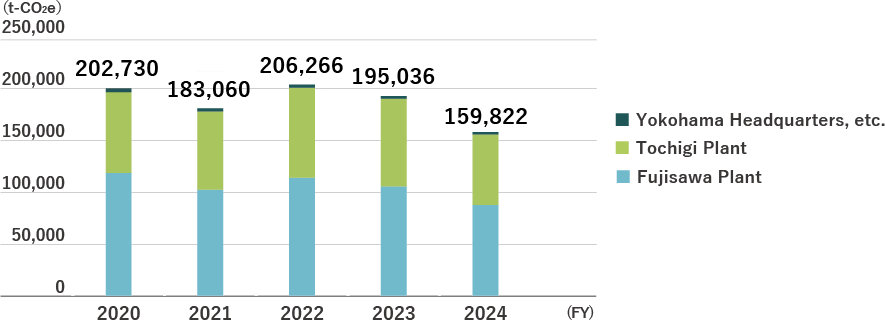
Trends in CO2 Emissions from Energy
Trends in Energy Consumption
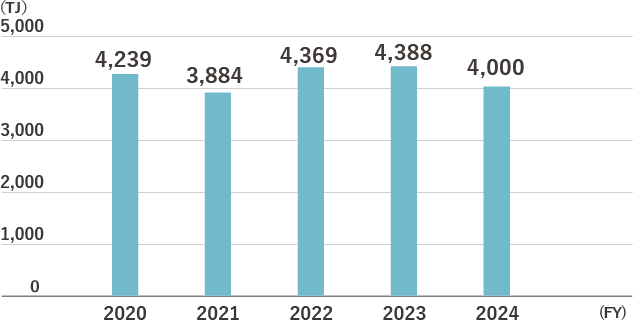
- *The energy coefficient has been changed for FY2024.
Trends in CO2 Emissions from Logistics
Activities to Reduce Resource Use
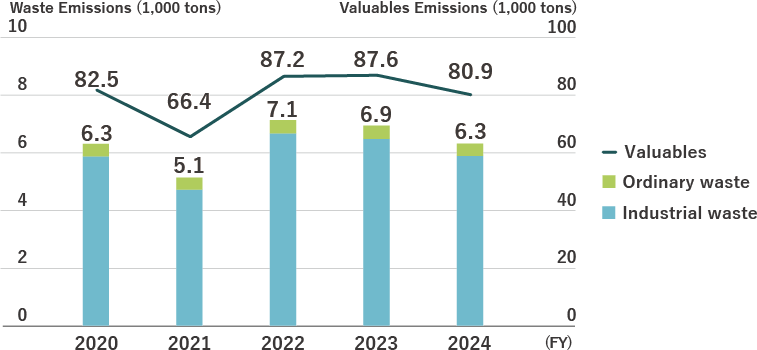
Reduce and Control Emissions
Trends in Waste Generation
Since FY2012, Isuzu has achieved zero emissions, with no waste being sent to landfills.
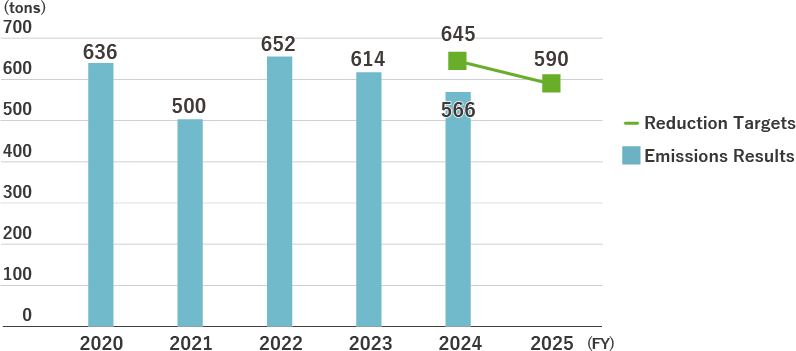
Trends in Plastic Product Industrial Waste Emissions
As Isuzu emits more than 250 tons of plastic product industrial waste annually, the company is classified as a large-volume emitter under the Act on Promotion of Resource Circulation for Plastics*.
In accordance with the law, Isuzu has set goals for reducing and recycling plastic product industrial waste and implemented initiatives to achieve these goals. In FY2025, we successfully met our targets.
Isuzu will continue to accelerate its efforts to reduce waste and promote recycling, advancing methodical initiatives to achieve future targets.
- *Act on promotion of resource circulation for plastics
Trends in Recycling Performance Based on Automobile Recycling
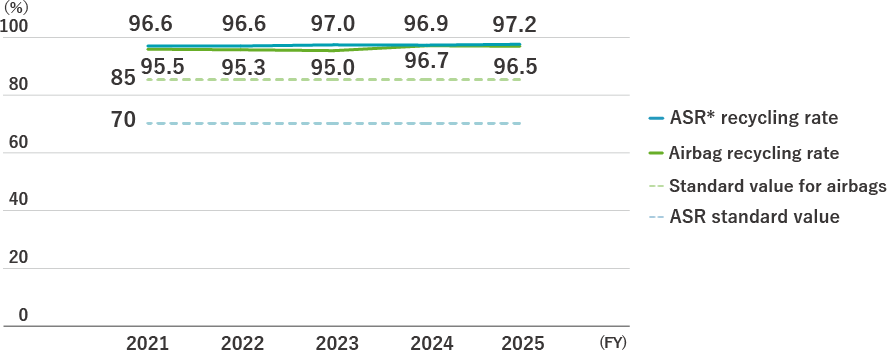
- *ASR: Automobile Shredder Residue
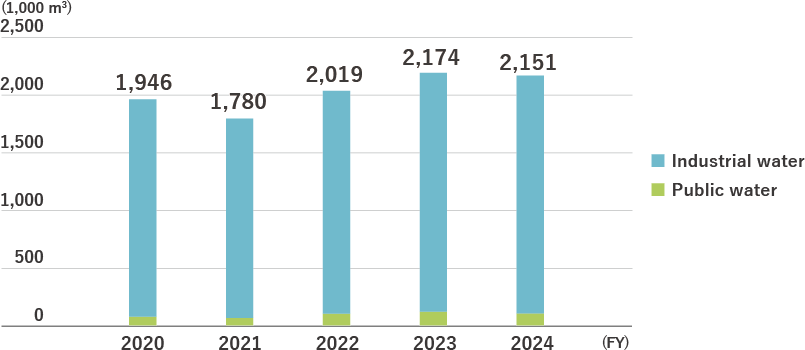
Reduction of Water Consumption
Trends in Water Resource Consumption
Environmental Risk Reduction Activities
Control Chlorofluorocarbon Emissions
In response to the Act for Control of Chlorofluorocarbon Emissions (Act on Rational Use and Proper Management of Fluorocarbons) effective from April 2015, Isuzu is promoting proper refrigerant management for business-use refrigeration air conditioning equipment and other equipment using chlorofluorocarbons at all of its bases, and is implementing inspections of all such equipment.
While this act requires business operators to report if their estimated leakage of chlorofluorocarbon exceeds 1,000 tons-CO2/year, Isuzu has verified that its leakage volume for FY2025 was lower than this level.
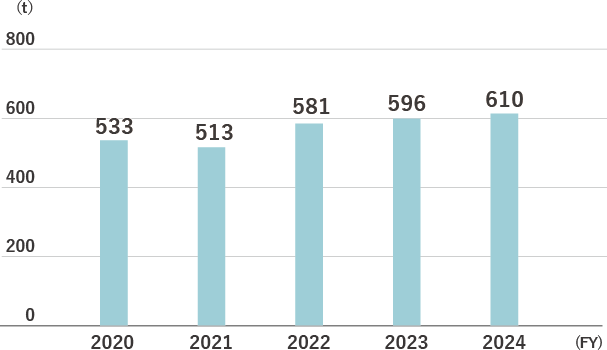
Reduction of VOC Emissions
Isuzu is reducing emissions through the recovery of volatile organic compounds (VOC), has reduced VOC emissions from its plants and reviewed and improved its painting processes, which entail particularly large VOC emissions.
This activity is promoted through voluntary efforts to reduce VOC emissions by the Japan Automobile Manufacturers Association, Inc.
Trend in Total VOC Emissions
Proper Management of Emissions and Wastewater
By properly maintaining boilers and other smoke-generating facilities, we ensure that the amount of air pollutants from emissions such as nitrogen oxides (NOx) and sulfur oxides (SOx) is within regulatory standard values*.
Further, wastewater from our plants is processed in a wastewater treatment facility before being discharged to sewer systems or public water areas. The discharged water is analyzed on a regular basis to ensure that it is within regulatory standard values.
- *Regulatory standard values are determined in accordance with laws or ordinances, whichever is stricter.
Fujisawa Plant: 8 Tsuchidana, Fujisawa City, Kanagawa Prefecture
Air
| Item | Equipment | Regulation Value | Measured Value | |
|---|---|---|---|---|
| Maximum | Average | |||
| NOx (ppm) | Boilers | 60 | 32 | 29.6 |
| Metal melting furnaces | 180 | 41 | 32.8 | |
| Paint baking furnaces | 230 | 93 | 88.5 | |
| Soot and dust (g/Nm3) | Boilers | 0.3 | 0.001 | 0.001 |
| Metal melting furnaces | 0.3 | 0.0074 | 0.0023 | |
| Paint baking furnaces | 0.2 | 0.0018 | 0.0018 | |
- *Since all facilities producing soot and smoke use city gas as their fuel, SOx is excluded from the scope of measurement.
Water Quality Discharge Destination: Hikiji River
| Item | Regulation Value | Measured Value | ||
|---|---|---|---|---|
| Maximum | Minimum | Average | ||
| pH | 5.8-8.6 | 7.9 | 7.1 | 7.7 |
| COD (mg/L) | 60 | 27.0 | 7.3 | 15.6 |
| BOD (mg/L) | 60 | 23.0 | 2.8 | 9.1 |
| SS (mg/L) | 90 | 14.0 | 2.0 | 6.6 |
| Oil content (mg/L) | 5 | 3.0 | 1.0 | 1.6 |
Tochigi Plant: 2691 Hakuchu, Ohira-Machi, Tochigi City, Tochigi Prefecture
Air
| Item | Equipment | Regulation Value | Measured Value | |
|---|---|---|---|---|
| Maximum | Average | |||
| NOx (ppm) | Boilers | 150 | 47 | 20 |
| Metal heating furnace | 180 | 170 | 97 | |
| Gas engines | 600 | 191 | 163 | |
| SOx (Nm3/h) | Total volume regulation | 14.5 | 0.3 | 0.01 |
| Soot and dust (g/Nm3) | Boilers | 0.1 | 0.001 | 0.001 |
| Metal heating furnace | 0.2 | 0.012 | 0.002 | |
| Gas engines | 0.05 | 0.002 | 0.001 | |
Water Quality Discharge Destination: Nagano River
| Item | Regulation Value | Measured Value | ||
|---|---|---|---|---|
| Maximum | Minimum | Average | ||
| pH | 5.8-8.6 | 7.6 | 7.2 | 7.3 |
| BOD (mg/L) | 20 | 16.8 | 1.8 | 6.1 |
| SS (mg/L) | 40 | 4.0 | 1.2 | 1.3 |
| Oil content (mg/L) | 5 | 0.0 | 0.0 | 0.0 |
- *COD is excluded from the scope of measurement since plant wastewater is discharged into rivers.
Environmental Accounting
To conduct environmental activities efficiently and continuously, Isuzu has calculated the costs and effects of environmental conservation.
We have disclosed information with the aim of helping to make management decisions for carrying out efficient investments in environmental activities, and as an evaluation index for businesses as well.
Environmental Conservation Costs
Total investment was 11,782 million yen, a 5,522 million yen increase YOY.
Total expenses were 61,085 million yen, a 8,238 million yen increase YOY.
Details are shown in the table below.
(Target Period: April 1, 2024 to March 31, 2025)
| Classification | Investment | Expenses | Major activities | |
|---|---|---|---|---|
| Business area costs | Pollution prevention costs | 362 | 391 | Prevention of air, water, and other kinds of pollution |
| Global environmental conservation costs | 2,153 | 529 | Implementing energy-saving activities, climate change measures, etc. | |
| Resource recycling costs | 181 | 132 | Proper disposal of waste, development and improvement of waste disposal sites, etc. | |
| Upstream/downstream costs | 0 | 4,832 | Encouraging the recycling of used automobiles, 3Rs for waste, etc. | |
| Management costs | 0 | 435 | Promoting environmental management, updating systems for gathering information such as environmental data, etc. | |
| R&D costs | 9,086 | 54,740 | R&D for eco-friendly products compliant with emissions regulations, etc. | |
| Social activity costs | 0 | 21 | Supporting environmental conservation activities such as tree planting, donating to environmental conservation organizations, etc. | |
| Environmental damage costs | 0 | 5 | Pollution load levy, conservation measures against soil and groundwater pollution, etc. | |
| Total | 11,782 | 61,085 | ||
Environmental Conservation Effects
(Period: April 1, 2024 to March 31, 2025)
| Category | Effect details | Effect |
|---|---|---|
| Economic effect (millions of yen) | Reduction in energy costs through energy conservation | 149 |
| Profit on sale of valuables | 3,023 | |
| Quantitative effect (t-CO2e) | CO2 reduction (t-CO2e) | 4,082 |
Business Activities and Environmental Hazards
| FY2023 | FY2024 | FY2025 | ||
|---|---|---|---|---|
| INPUT | Energy input (GJ) | 4,387,635 | 3,999,645 | 3,960,848 |
| Power consumption | 2,076,515 | 1,682,534 | 1,725,066 | |
| LPG | 31,812 | 22,019 | 20,084 | |
| LNG | 808,459 | 918,627 | 859,485 | |
| City gas | 1,173,833 | 1,125,039 | 1,130,095 | |
| Other energy | 297,016 | 251,426 | 226,118 | |
| Raw material input amount (thousand-t) | ||||
| Iron and steel | 43 | 33 | 27 | |
| Aluminum | 10 | 15 | 7 | |
| Raw materials | 152 | 125 | 99 | |
| Water usage (thousand m3) | 2,174 | 2,151 | 2,004 | |
| Industrial Water | 2,055 | 2,047 | 1,912 | |
| Public Water | 119 | 104 | 92 | |
| OUTPUT | Greenhouse gas (GHG) (t-CO2e) *1 | 195,036 | 159,822 | 161,866 |
| Waste generation (thousand-t) | 6.9 | 6.3 | 6.1 | |
| Final landfill (thousand-t) | 0.0 | 0.0 | 0.0 | |
| Valuables (thousand-t) | 87.6 | 80.9 | 81.7 | |
| Recycling result (%) | ||||
| ASR | 97.0 | 96.9 | 97.2 | |
| Air bags | 95.0 | 96.7 | 96.5 | |
| VOC emissions (t) | 596 | 610 | 610 | |
| Wastewater (thousand m3) | 2,174 | 2,151 | 2,004 | |
- ※Sum of Scope 1 and Scope 2
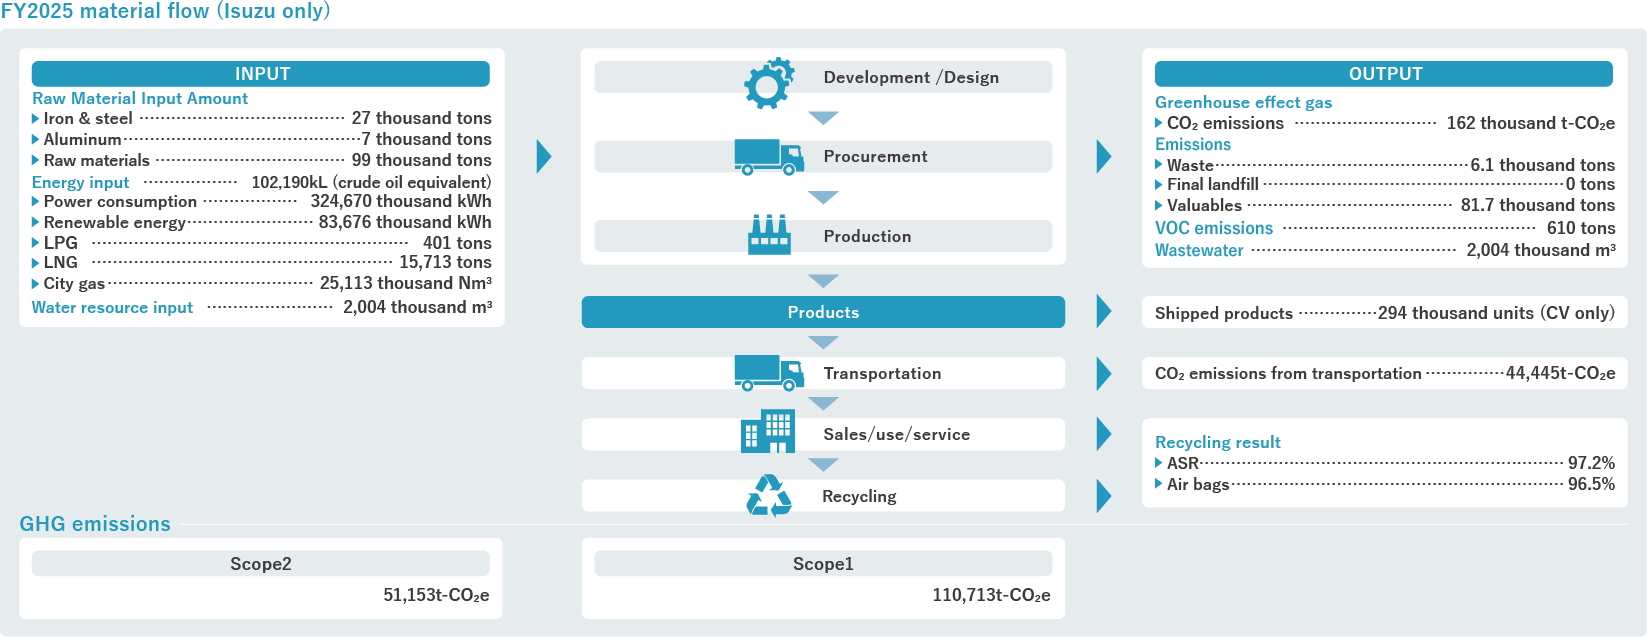
Material Flow
Isuzu Group’s GHG emissions
| FY2023 | FY2024 | FY2025 | |
|---|---|---|---|
| Total GHG emissions (t-CO2e) | 159,505,336 | 126,313,253 | 110,455,324 |
| Scope1 | 196,182 | 182,536 | 172,302 |
| Scope2 | 347,151 | 271,812 | 260,785 |
| Scope3 Total | 158,962,003 | 125,858,905 | 110,022,237 |
| Category 1 | 11,424,587 | 11,603,511 | 10,691,250 |
| Category 2*1 | 274,637 | 264,658 | 375,330 |
| Category 3*2 | 126,172 | 115,757 | 73,992 |
| Category 4 | 291,709 | 308,902 | 305,337 |
| Category 5※2 | 268,355 | 133,553 | 12,207 |
| Category 6 | 7,753 | 7,734 | 7,070 |
| Category 7 | 27,411 | 27,322 | 24,800 |
| Category 8 | - | - | - |
| Category 9 | 553,476 | 471,034 | 344,229 |
| Category 10 | 15,552 | 14,275 | 14,444 |
| Category 11 | 145,727,206 | 112,684,194 | 97,945,388 |
| Category 12 | 173,636 | 141,733 | 160,177 |
| Category 13 | - | - | - |
| Category 14 | - | - | - |
| Category 15 | 71,509 | 86,232 | 68,013 |
- ・In order to achieve a more comprehensive and accurate calculation in all categories, the scope of calculation was revised based on actual results for fiscal 2025, resulting in an expansion of the business activities and products subject to calculation. Therefore, we have retroactively recalculated the results for fiscal 2023 and fiscal 2024.
- ・Third-party assurance has been obtained for Scope 3 results for fiscal 2025.
- ・Scope 1 and 2 results for fiscal 2025 are provisional values, as companies that are still compiling data are included in the calculation range.
- *1Due to changes in accounting standards from fiscal 2005 results, activity volume increased, resulting in an increase in emissions.
- *2Due to a decrease in the number of items and locations subject to calculation from fiscal 2005 results, activity volume decreased, resulting in a reduction in emissions.
Isuzu’s GHG emissions
| FY2023 | FY2024 | FY2025 | |
|---|---|---|---|
| Total GHG emissions (t-CO2e) | 195,036 | 159,822 | 161,866 |
| Scope1 | 119,189 | 115,370 | 110,713 |
| Scope2 | 75,847 | 44,452 | 51,153 |
- ・Third-party assurance has been obtained for the results for FY2023, FY2024, and FY2025.
Calculation Standards
| Calculation Period | FY2025 (April 1, 2024 to March 31, 2025) |
|---|---|
| Metrics Calculation Scope | Non-consolidated: ISUZU MOTORS LIMITED |
| Consolidated: ISUZU MOTORS LIMITED and its 91 domestic and overseas consolidated subsidiaries |
| Greenhouse Gas (GHG) | Scope | Units | Calculation Standards |
|---|---|---|---|
| GHG | Non-consolidated | - |
Scope 1 emissions (direct emissions), Scope 2 emissions (indirect emissions from energy use), and Scope 3 emissions (other indirect emissions) [Calculation Standards]
|
| Scope 1 | Non-consolidated | t-CO2e |
Greenhouse gas emissions from fuel use (direct emissions) [Factor]
|
| Scope 2 | Non-consolidated | t-CO2e |
Greenhouse gas emissions from the use of externally supplied electricity and heat (indirect emissions) [Factor]
|
| Scope 3 | Consolidated | t-CO2e |
Other greenhouse gas emissions (indirect emissions) [Calculation Standards] Category 1: Purchased goods and services [Coefficient, Intensity]
|
| Scope | Units | Calculation Standards | |
|---|---|---|---|
| Water Usage | Non-consolidated | thousand m3 |
Total Water Usage (Public water, groundwater, industrial water) [Calculation Standards]
|
| Scope | Units | Calculation Standards | |
|---|---|---|---|
| Waste Generation | Non-consolidated | thousand t |
Total Emissions of Waste [Calculation Standards]
|
Independent Assurance Report (PDF)