Consolidated Financial Highlights
Transition of main financial index for the past ten years is reported in several diagrams and graphs.
Operating Results (Consolidated)
As of June 30 2025
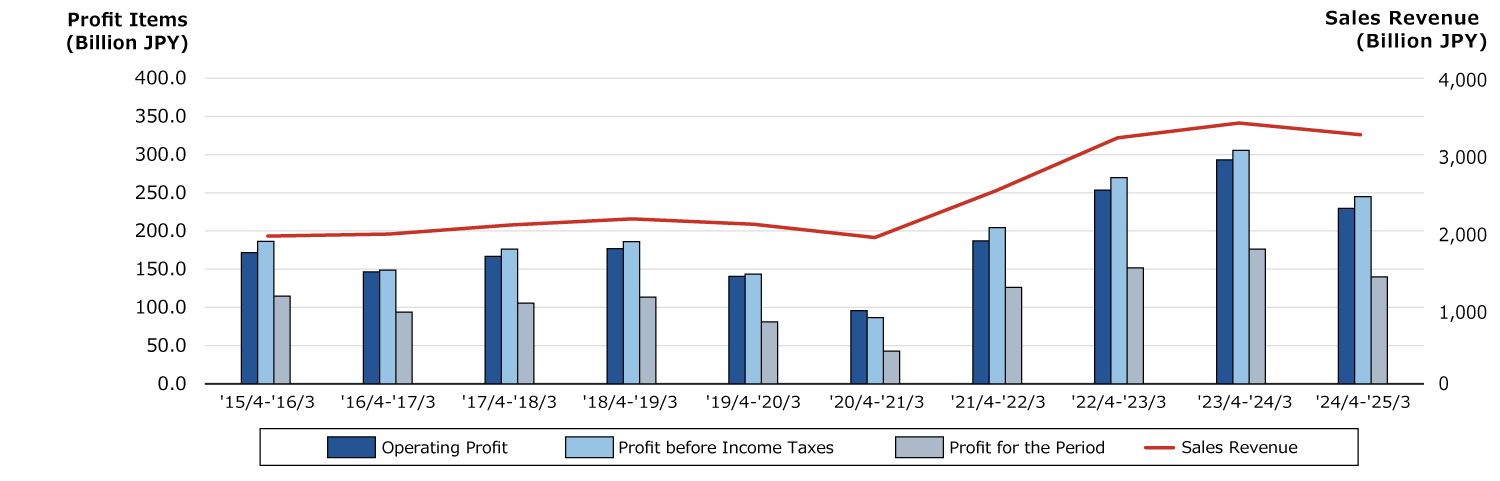
| (Billion JPY) | '15/4-'16/3 | '16/4-'17/3 | '17/4-'18/3 | '18/4-'19/3 | '19/4-'20/3 | '20/4-'21/3 | '21/4-'22/3 | '22/4-'23/3 | '23/4-'24/3 | '24/4-'25/3 |
|---|---|---|---|---|---|---|---|---|---|---|
| Sales Revenue*1 | 1,927.0 | 1,953.2 | 2,070.4 | 2,149.2 | 2,079.9 | 1,908.2 | 2,514.3 | 3,195.5 | 3,386.7 | 3,235.6 |
| Operating Profit | 171.6 | 146.4 | 166.8 | 176.8 | 140.6 | 95.7 | 187.2 | 253.5 | 293.1 | 229.5 |
| Profit before Income Taxes*2 | 186.4 | 148.9 | 176.1 | 186.1 | 143.5 | 86.8 | 204.3 | 269.8 | 305.6 | 245.0 |
| Profit for the Period*3 | 114.7 | 93.9 | 105.7 | 113.4 | 81.2 | 42.7 | 126.2 | 151.7 | 176.4 | 140.1 |
| (J-GAAP) | (J-GAAP) | (J-GAAP) | (J-GAAP) | (J-GAAP) | (J-GAAP) | (J-GAAP) | (J-GAAP) | (J-GAAP) | (IFRS) |
- *1“Sales” under J-GAAP is shown as “Sales Revenue”
- *2“Income Before Income Taxes” under J-GAAP is shown as “Profit Before Income Taxes”
- *3“Profit for the Period Attributable to Owners of the Parent" under IFRS and “Net income attributable to owners of the parent” under J-GAAP are shown as “Profit for the Period”
Sales Revenue by Regional Operations
As of June 30 2025
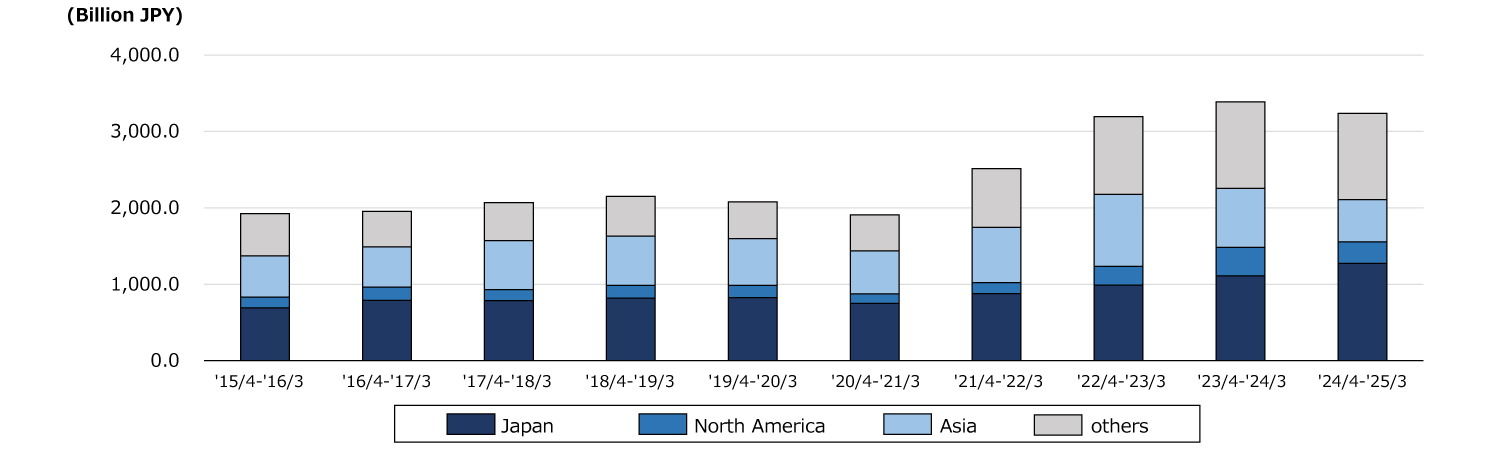
| (Billion JPY) | '15/4-'16/3 | '16/4-'17/3 | '17/4-'18/3 | '18/4-'19/3 | '19/4-'20/3 | '20/4-'21/3 | '21/4-'22/3 | '22/4-'23/3 | '23/4-'24/3 | '24/4-'25/3 |
|---|---|---|---|---|---|---|---|---|---|---|
| Japan | 693.1 | 788.4 | 786.9 | 819.2 | 827.2 | 751.6 | 878.1 | 989.8 | 1,108.9 | 1,275.4 |
| North America | 141.3 | 173.3 | 143.1 | 166.8 | 157.8 | 121.8 | 142.8 | 245.3 | 372.9 | 279.2 |
| Asia | 541.5 | 529.6 | 640.4 | 644.6 | 613.3 | 563.9 | 724.6 | 942.8 | 773.9 | 554.9 |
| others | 551.1 | 461.9 | 500.0 | 518.6 | 481.6 | 470.9 | 768.8 | 1,017.6 | 1,131.0 | 1,126.1 |
| Total | 1,927.0 | 1,953.2 | 2,070.4 | 2,149.2 | 2,079.9 | 1,908.2 | 2,514.3 | 3,195.5 | 3,386.7 | 3,235.6 |
| (J-GAAP) | (J-GAAP) | (J-GAAP) | (J-GAAP) | (J-GAAP) | (J-GAAP) | (J-GAAP) | (J-GAAP) | (J-GAAP) | (IFRS) |
- *1“Sales” under J-GAAP is shown as “Sales Revenue”
Sales Revenue by Regions
As of June 30 2025
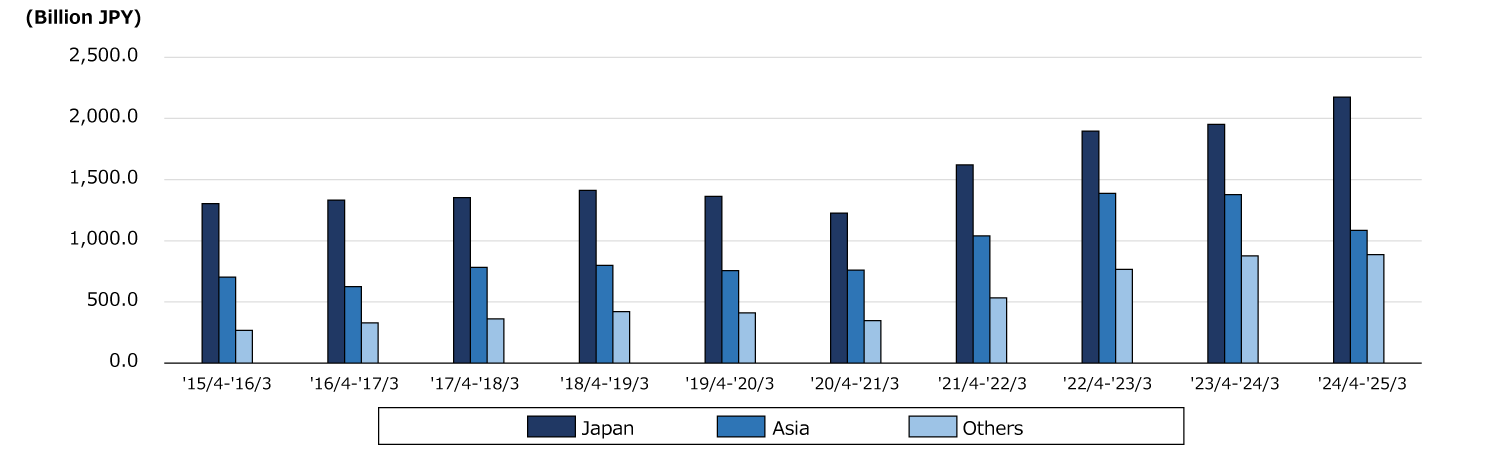
| (Billion JPY) | '15/4-'16/3 | '16/4-'17/3 | '17/4-'18/3 | '18/4-'19/3 | '19/4-'20/3 | '20/4-'21/3 | '21/4-'22/3 | '22/4-'23/3 | '23/4-'24/3 | '24/4-'25/3 |
|---|---|---|---|---|---|---|---|---|---|---|
| Japan | 1,303.8 | 1,332.8 | 1,353.5 | 1,411.6 | 1,363.4 | 1,225.9 | 1,619.6 | 1,897.0 | 1,951.0 | 2,174.0 |
| Asia | 702.5 | 625.8 | 781.9 | 799.1 | 756.1 | 758.8 | 1,040.2 | 1,386.9 | 1,377.4 | 1,085.7 |
| Others | 267.8 | 329.2 | 361.3 | 420.1 | 409.2 | 345.7 | 532.0 | 765.3 | 877.2 | 887.0 |
| Eliminations | -347.1 | -334.6 | -426.3 | -481.6 | -448.8 | -422.2 | -677.5 | -853.7 | -818.9 | -911.1 |
| Total | 1,927.0 | 1,953.2 | 2,070.4 | 2,149.2 | 2,079.9 | 1,908.2 | 2,514.3 | 3,195.5 | 3,386.7 | 3,235.6 |
| (J-GAAP) | (J-GAAP) | (J-GAAP) | (J-GAAP) | (J-GAAP) | (J-GAAP) | (J-GAAP) | (J-GAAP) | (J-GAAP) | (IFRS) |
- *1“Sales” under J-GAAP is shown as “Sales Revenue”
Operating Profit by Regions
As of June 30 2025
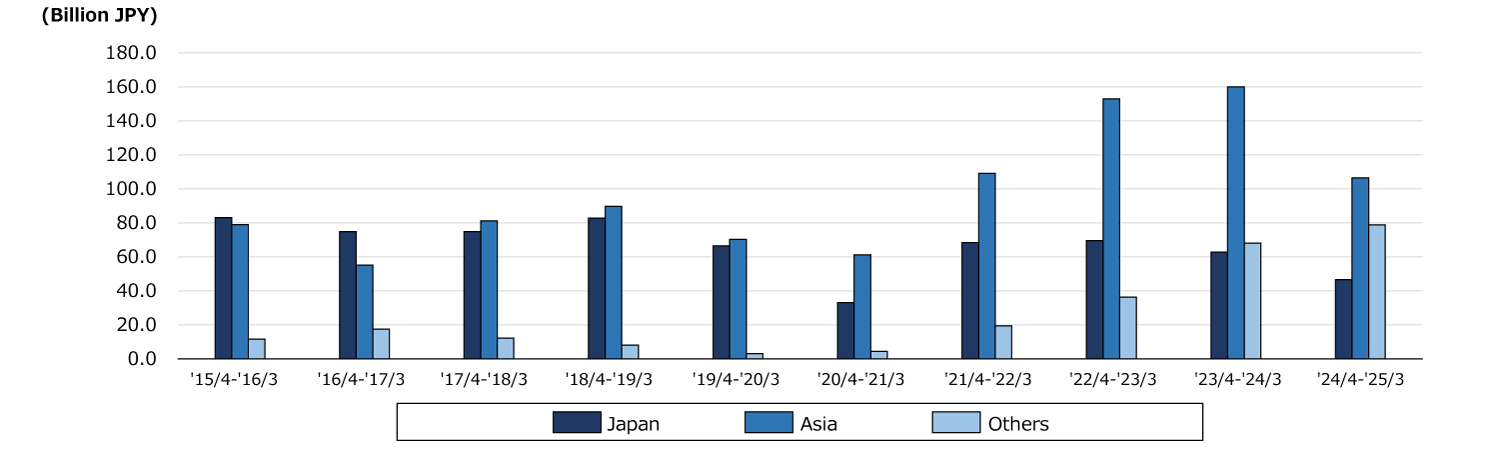
| (Billion JPY) | '15/4-'16/3 | '16/4-'17/3 | '17/4-'18/3 | '18/4-'19/3 | '19/4-'20/3 | '20/4-'21/3 | '21/4-'22/3 | '22/4-'23/3 | '23/4-'24/3 | '24/4-'25/3 |
|---|---|---|---|---|---|---|---|---|---|---|
| Japan | 83.0 | 74.8 | 74.8 | 82.7 | 66.4 | 33.0 | 68.4 | 69.5 | 62.7 | 46.5 |
| Asia | 79.0 | 55.1 | 81.1 | 89.7 | 70.2 | 61.2 | 109.1 | 152.9 | 159.9 | 106.5 |
| Others | 11.6 | 17.4 | 12.1 | 8.1 | 3.0 | 4.4 | 19.4 | 36.3 | 68.1 | 78.8 |
| Eliminations | -2.0 | -0.9 | -1.2 | -3.7 | 1.0 | -2.9 | -9.7 | -5.2 | 2.4 | -2.3 |
| Total | 171.6 | 146.4 | 166.8 | 176.8 | 140.6 | 95.7 | 187.2 | 253.5 | 293.1 | 229.5 |
| (J-GAAP) | (J-GAAP) | (J-GAAP) | (J-GAAP) | (J-GAAP) | (J-GAAP) | (J-GAAP) | (J-GAAP) | (J-GAAP) | (IFRS) |
R&D Expenditures, CAPEX and Depreciation Cost
As of June 30 2025
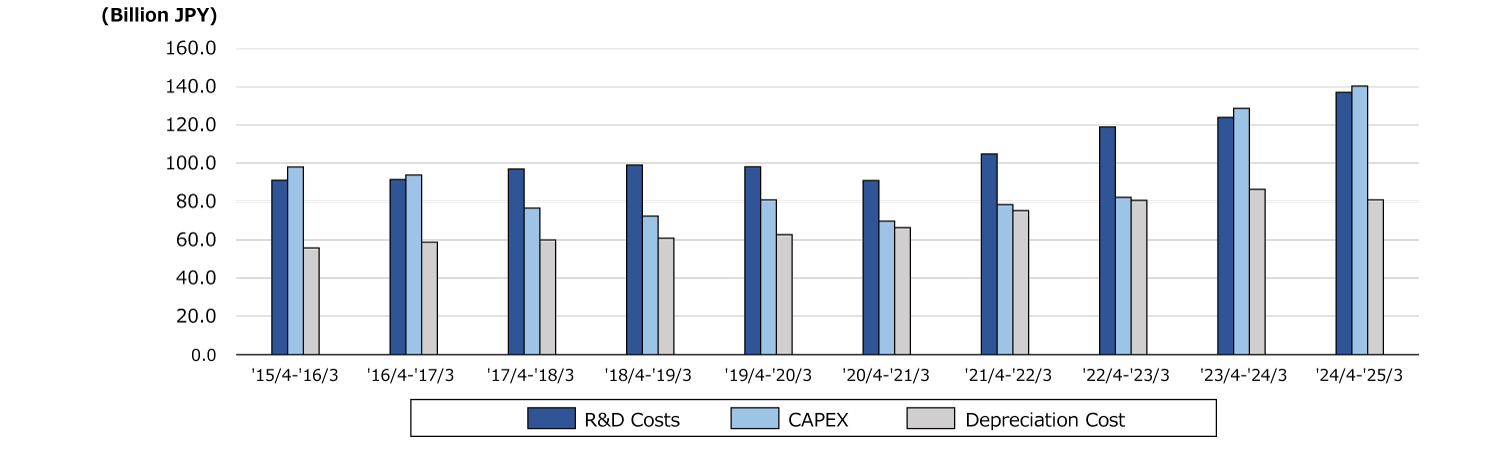
| (Billion JPY) | '15/4-'16/3 | '16/4-'17/3 | '17/4-'18/3 | '18/4-'19/3 | '19/4-'20/3 | '20/4-'21/3 | '21/4-'22/3 | '22/4-'23/3 | '23/4-'24/3 | '24/4-'25/3 |
|---|---|---|---|---|---|---|---|---|---|---|
| R&D Costs*1 | 91.1 | 91.4 | 97.0 | 99.0 | 98.1 | 91.0 | 104.8 | 119.0 | 123.9 | 137.0 |
| CAPEX*2 | 98.0 | 93.8 | 76.6 | 72.3 | 80.8 | 69.8 | 78.4 | 82.2 | 128.6 | 140.2 |
| Depreciation Cost*2 | 55.8 | 58.8 | 59.9 | 60.9 | 62.7 | 66.3 | 75.3 | 80.6 | 86.4 | 80.8 |
- *1Expenditures related to R&D activities incurred during the reporting period and differs from the R&D expenses presented in the consolidated statement of profit or loss under IFRS.
- *2Capital expenditures and depreciation related to vehicles on operating leases and right-of-use assets are not included.
Shareholders’ Equity
As of June 30 2025
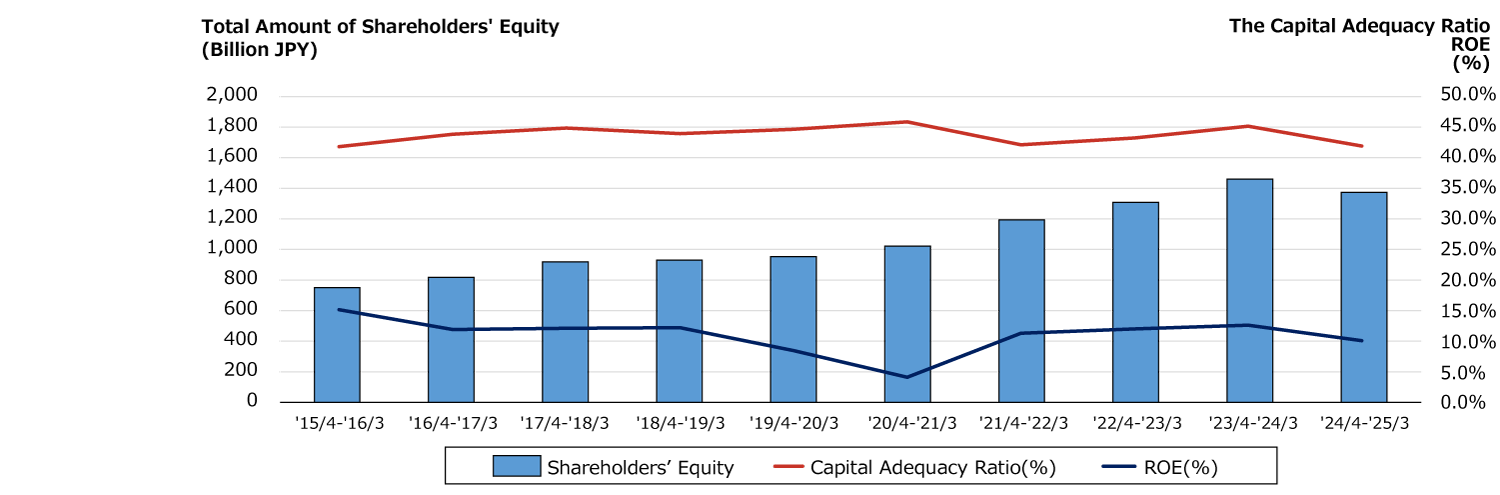
| (Billion JPY) | '15/4-'16/3 | '16/4-'17/3 | '17/4-'18/3 | '18/4-'19/3 | '19/4-'20/3 | '20/4-'21/3 | '21/4-'22/3 | '22/4-'23/3 | '23/4-'24/3 | '24/4-'25/3 |
|---|---|---|---|---|---|---|---|---|---|---|
| Shareholders’ Equity | 751.4 | 818.4 | 919.6 | 929.8 | 952.9 | 1,021.8 | 1,194.1 | 1,308.5 | 1,460.7 | 1,372.9 |
| Capital Adequacy Ratio(%) | 41.5% | 43.5% | 44.5% | 43.6% | 44.3% | 45.5% | 41.8% | 42.9% | 44.8% | 41.6% |
| ROE(%) | 15.2% | 12.0% | 12.2% | 12.3% | 8.6% | 4.3% | 11.4% | 12.1% | 12.7% | 10.2% |
| (J-GAAP) | (J-GAAP) | (J-GAAP) | (J-GAAP) | (J-GAAP) | (J-GAAP) | (J-GAAP) | (J-GAAP) | (J-GAAP) | (IFRS) |
- *1Display “Total equity attributable to owners of the parent” under IFRS as ”Tangible net worth”.
- *2Display the “ratio of equity attributable to owners of the parent” under IFRS as the “The Capital adequacy ratio”.
Dividend
As of June 30 2025
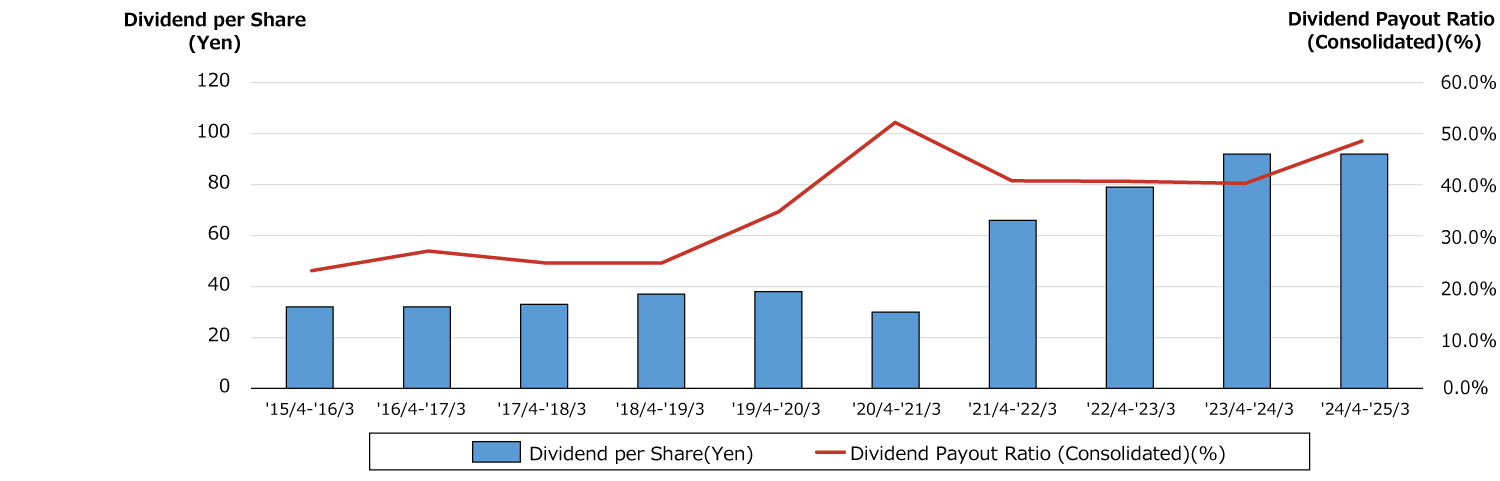
| '15/4-'16/3 | '16/4-'17/3 | '17/4-'18/3 | '18/4-'19/3 | '19/4-'20/3 | '20/4-'21/3 | '21/4-'22/3 | '22/4-'23/3 | '23/4-'24/3 | '24/4-'25/3 | |
|---|---|---|---|---|---|---|---|---|---|---|
| Dividend per Share(Yen) | 32 | 32 | 33 | 37 | 38 | 30 | 66 | 79 | 92 | 92 |
| Dividend Payout Ratio (Consolidated)(%) | 23.1% | 26.9% | 24.6% | 24.6% | 34.5% | 51.8% | 40.5% | 40.4% | 40.0% | 48.2% |
| (J-GAAP) | (J-GAAP) | (J-GAAP) | (J-GAAP) | (J-GAAP) | (J-GAAP) | (J-GAAP) | (J-GAAP) | (J-GAAP) | (IFRS) |
Total Payout Ratio
As of June 30 2025
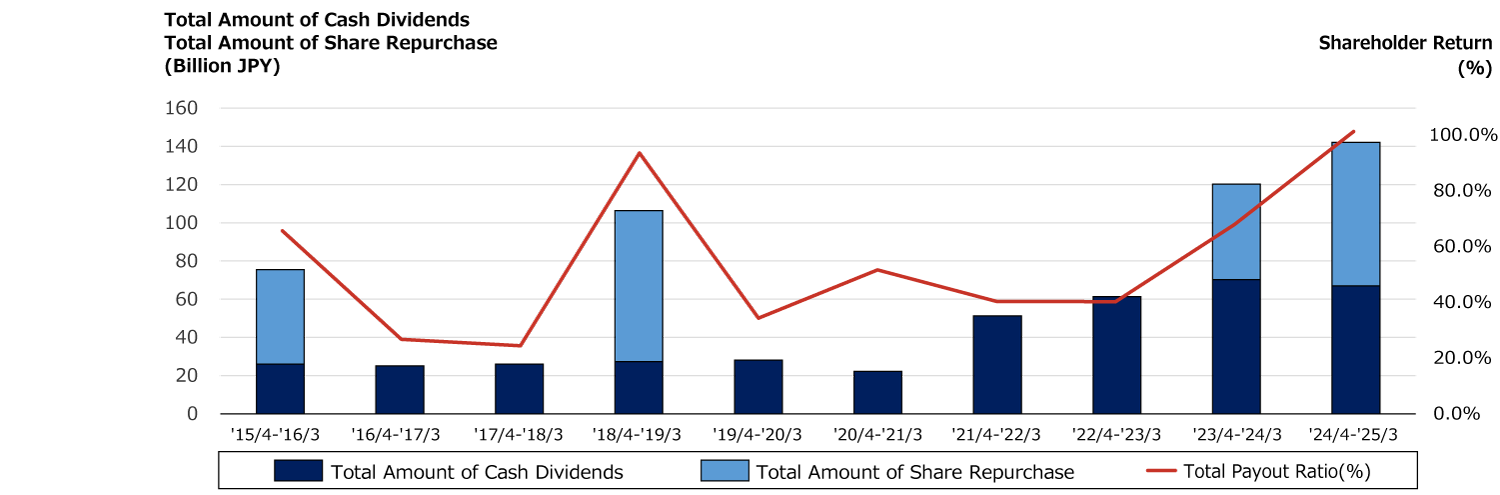
| (Billion JPY) | '15/4-'16/3 | '16/4-'17/3 | '17/4-'18/3 | '18/4-'19/3 | '19/4-'20/3 | '20/4-'21/3 | '21/4-'22/3 | '22/4-'23/3 | '23/4-'24/3 | '24/4-'25/3 |
|---|---|---|---|---|---|---|---|---|---|---|
| Total Amount of Cash Dividends | 26.0 | 25.2 | 26.0 | 27.3 | 28.1 | 22.2 | 51.3 | 61.4 | 70.2 | 67.0 |
| Total Amount of Share Repurchase | 49.5 | - | - | 79.0 | - | - | - | - | 50.0 | 75.0 |
| Total Payout Ratio(%) | 65.8% | 26.9% | 24.6% | 93.7% | 34.5% | 51.8% | 40.5% | 40.4% | 68.1% | 101.4% |
| (J-GAAP) | (J-GAAP) | (J-GAAP) | (J-GAAP) | (J-GAAP) | (J-GAAP) | (J-GAAP) | (J-GAAP) | (J-GAAP) | (IFRS) |
Interest-Bearing Debt
As of June 30 2025
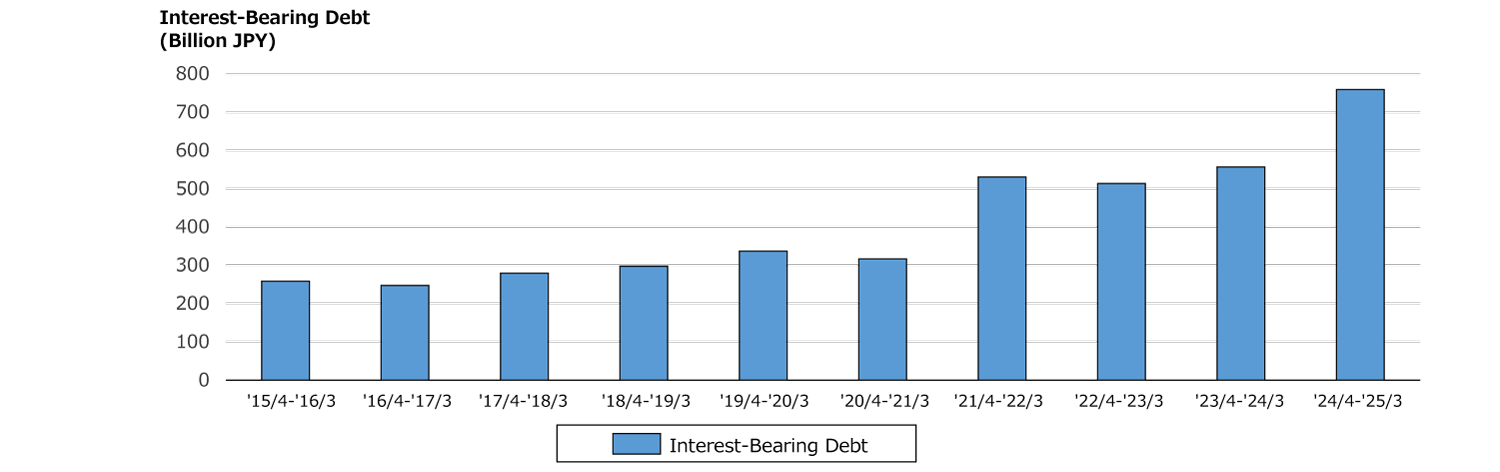
| (Billion JPY) | '15/4-'16/3 | '16/4-'17/3 | '17/4-'18/3 | '18/4-'19/3 | '19/4-'20/3 | '20/4-'21/3 | '21/4-'22/3 | '22/4-'23/3 | '23/4-'24/3 | '24/4-'25/3 |
|---|---|---|---|---|---|---|---|---|---|---|
| Interest-Bearing Debt | 258.7 | 247.3 | 279.6 | 297.4 | 336.7 | 316.6 | 530.5 | 513.1 | 556.8 | 758.8 |
| (J-GAAP) | (J-GAAP) | (J-GAAP) | (J-GAAP) | (J-GAAP) | (J-GAAP) | (J-GAAP) | (J-GAAP) | (J-GAAP) | (IFRS) |
Cash Flows
As of June 30 2025
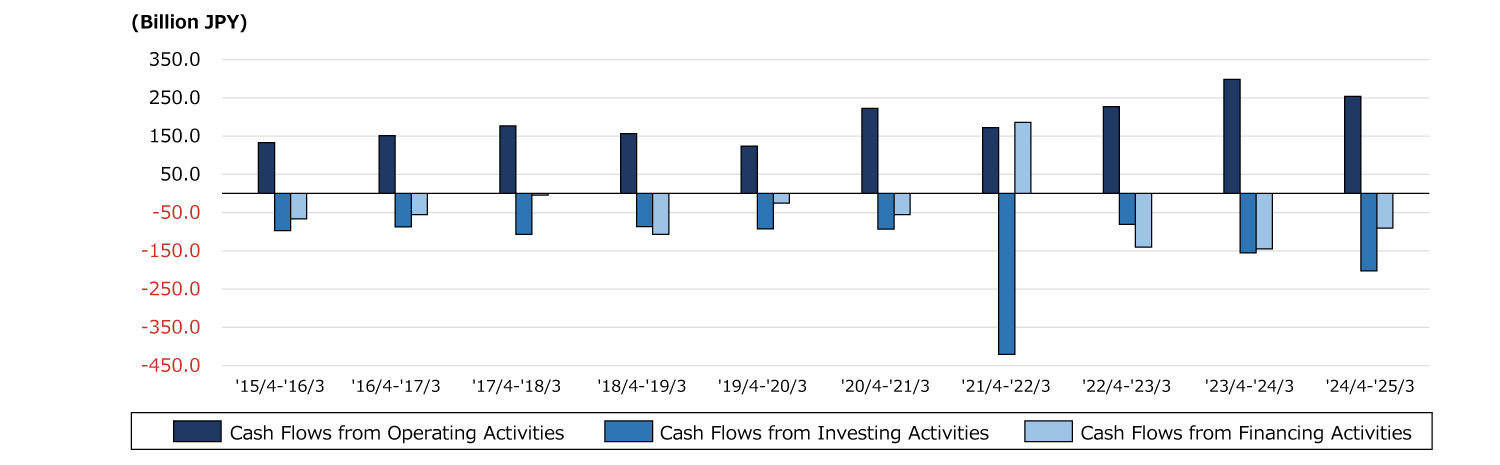
| (Billion JPY) | '15/4-'16/3 | '16/4-'17/3 | '17/4-'18/3 | '18/4-'19/3 | '19/4-'20/3 | '20/4-'21/3 | '21/4-'22/3 | '22/4-'23/3 | '23/4-'24/3 | '24/4-'25/3 |
|---|---|---|---|---|---|---|---|---|---|---|
| Cash Flows from Operating Activities | 133.0 | 151.4 | 176.8 | 156.5 | 123.7 | 222.9 | 172.1 | 227.1 | 298.6 | 254.1 |
| Cash Flows from Investing Activities | -96.8 | -87.4 | -107.0 | -86.6 | -92.7 | -93.4 | -420.9 | -80.5 | -155.1 | -202.4 |
| Cash Flows from Financing Activities | -66.7 | -55.4 | -4.4 | -106.9 | -25.2 | -55.3 | 186.1 | -140.4 | -145.0 | -90.6 |
| Free Cash Flow | 36.2 | 64.0 | 69.8 | 70.0 | 31.0 | 129.5 | -248.8 | 146.6 | 143.5 | 51.7 |
| (J-GAAP) | (J-GAAP) | (J-GAAP) | (J-GAAP) | (J-GAAP) | (J-GAAP) | (J-GAAP) | (J-GAAP) | (J-GAAP) | (IFRS) | |